


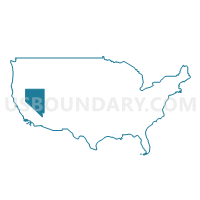
Assembly District 17, Nevada
About
Outline

Summary
| Unique Area Identifier | 197677 |
| Name | Assembly District 17 |
| State | Nevada |
| Area (square miles) | 1,594.23 |
| Land Area (square miles) | 1,593.19 |
| Water Area (square miles) | 1.03 |
| % of Land Area | 99.94 |
| % of Water Area | 0.06 |
| Latitude of the Internal Point | 36.55896990 |
| Longtitude of the Internal Point | -115.28626620 |
| Total Population | 96,848 |
| Total Housing Units | 35,403 |
| Total Households | 30,613 |
| Median Age | 30.4 |
Maps

Graphs
Select a template below for downloading or customizing gragh for Assembly District 17, Nevada


Neighbors
Neighoring State Legislative District Lower Chamber (by Name) Neighboring State Legislative District Lower Chamber on the Map
- Assembly District 1, NV
- Assembly District 13, NV
- Assembly District 19, NV
- Assembly District 20, NV
- Assembly District 36, NV
- Assembly District 7, NV
Top 10 Neighboring County (by Population) Neighboring County on the Map
Top 10 Neighboring County Subdivision (by Population) Neighboring County Subdivision on the Map
- Las Vegas CCD, Clark County, NV (1,771,945)
- Clark CCD, Clark County, NV (179,324)
- Pahrump CCD, Nye County, NV (36,583)
- Alamo CCD, Lincoln County, NV (1,398)
- Yucca Flat CCD, Nye County, NV (0)
Top 10 Neighboring Place (by Population) Neighboring Place on the Map
- Las Vegas city, NV (583,756)
- North Las Vegas city, NV (216,961)
- Sunrise Manor CDP, NV (189,372)
- Nellis AFB CDP, NV (3,187)
- Indian Springs CDP, NV (991)
Top 10 Neighboring Unified School District (by Population) Neighboring Unified School District on the Map
- Clark County School District, NV (1,951,269)
- Nye County School District, NV (43,946)
- Lincoln County School District, NV (5,345)
Top 10 Neighboring State Legislative District Upper Chamber (by Population) Neighboring State Legislative District Upper Chamber on the Map
- Clark County Senatorial District 9, NV (354,064)
- Clark County Senatorial District 12, NV (214,362)
- Clark County Senatorial District 1, NV (153,621)
- Clark County Senatorial District 4, NV (123,866)
- Central Nevada Senatorial District, NV (113,138)
- Rural Nevada Senatorial District, NV (97,335)
- Clark County Senatorial District 2, NV (96,601)
Top 10 Neighboring 111th Congressional District (by Population) Neighboring 111th Congressional District on the Map
- Congressional District 3, NV (1,043,855)
- Congressional District 2, NV (836,562)
- Congressional District 1, NV (820,134)
Top 10 Neighboring Census Tract (by Population) Neighboring Census Tract on the Map
- Census Tract 36.28, Clark County, NV (7,841)
- Census Tract 36.18, Clark County, NV (7,510)
- Census Tract 36.07, Clark County, NV (7,220)
- Census Tract 36.25, Clark County, NV (6,727)
- Census Tract 33.14, Clark County, NV (6,547)
- Census Tract 36.13, Clark County, NV (6,475)
- Census Tract 47.14, Clark County, NV (6,367)
- Census Tract 75, Clark County, NV (6,314)
- Census Tract 9604.01, Nye County, NV (6,158)
- Census Tract 47.15, Clark County, NV (6,027)
Top 10 Neighboring 5-Digit ZIP Code Tabulation Area (by Population) Neighboring 5-Digit ZIP Code Tabulation Area on the Map
- 89031, NV (60,589)
- 89115, NV (58,794)
- 89030, NV (53,928)
- 89131, NV (43,072)
- 89032, NV (40,297)
- 89081, NV (29,774)
- 89084, NV (21,837)
- 89166, NV (13,209)
- 89143, NV (12,786)
- 89060, NV (10,227)
Data
Demographic, Population, Households, and Housing Units
** Data sources from census 2010 **
Show Data on Map
Download Full List as CSV
Download Quick Sheet as CSV
| Subject | This Area | Nevada | National |
|---|---|---|---|
| POPULATION | |||
| Total Population Map | 96,848 | 2,700,551 | 308,745,538 |
| POPULATION, HISPANIC OR LATINO ORIGIN | |||
| Not Hispanic or Latino Map | 66,450 | 1,984,050 | 258,267,944 |
| Hispanic or Latino Map | 30,398 | 716,501 | 50,477,594 |
| POPULATION, RACE | |||
| White alone Map | 47,168 | 1,786,688 | 223,553,265 |
| Black or African American alone Map | 20,106 | 218,626 | 38,929,319 |
| American Indian and Alaska Native alone Map | 778 | 32,062 | 2,932,248 |
| Asian alone Map | 6,955 | 195,436 | 14,674,252 |
| Native Hawaiian and Other Pacific Islander alone Map | 1,049 | 16,871 | 540,013 |
| Some Other Race alone Map | 14,539 | 324,793 | 19,107,368 |
| Two or More Races Map | 6,253 | 126,075 | 9,009,073 |
| POPULATION, SEX | |||
| Male Map | 47,856 | 1,363,616 | 151,781,326 |
| Female Map | 48,992 | 1,336,935 | 156,964,212 |
| POPULATION, AGE (18 YEARS) | |||
| 18 years and over Map | 66,680 | 2,035,543 | 234,564,071 |
| Under 18 years | 30,168 | 665,008 | 74,181,467 |
| POPULATION, AGE | |||
| Under 5 years | 8,769 | 187,478 | 20,201,362 |
| 5 to 9 years | 8,428 | 183,077 | 20,348,657 |
| 10 to 14 years | 8,233 | 183,173 | 20,677,194 |
| 15 to 17 years | 4,738 | 111,280 | 12,954,254 |
| 18 and 19 years | 2,686 | 71,320 | 9,086,089 |
| 20 years | 1,329 | 35,554 | 4,519,129 |
| 21 years | 1,393 | 34,258 | 4,354,294 |
| 22 to 24 years | 4,143 | 107,697 | 12,712,576 |
| 25 to 29 years | 8,094 | 196,644 | 21,101,849 |
| 30 to 34 years | 8,325 | 190,642 | 19,962,099 |
| 35 to 39 years | 7,952 | 191,652 | 20,179,642 |
| 40 to 44 years | 7,161 | 191,391 | 20,890,964 |
| 45 to 49 years | 6,491 | 193,790 | 22,708,591 |
| 50 to 54 years | 5,394 | 182,737 | 22,298,125 |
| 55 to 59 years | 4,363 | 164,575 | 19,664,805 |
| 60 and 61 years | 1,558 | 62,389 | 7,113,727 |
| 62 to 64 years | 2,056 | 88,535 | 9,704,197 |
| 65 and 66 years | 1,127 | 49,613 | 5,319,902 |
| 67 to 69 years | 1,346 | 65,888 | 7,115,361 |
| 70 to 74 years | 1,549 | 82,280 | 9,278,166 |
| 75 to 79 years | 941 | 57,503 | 7,317,795 |
| 80 to 84 years | 469 | 38,888 | 5,743,327 |
| 85 years and over | 303 | 30,187 | 5,493,433 |
| MEDIAN AGE BY SEX | |||
| Both sexes Map | 30.40 | 36.30 | 37.20 |
| Male Map | 29.90 | 35.80 | 35.80 |
| Female Map | 30.80 | 36.90 | 38.50 |
| HOUSEHOLDS | |||
| Total Households Map | 30,613 | 1,006,250 | 116,716,292 |
| HOUSEHOLDS, HOUSEHOLD TYPE | |||
| Family households: Map | 23,163 | 656,621 | 77,538,296 |
| Husband-wife family Map | 16,109 | 462,509 | 56,510,377 |
| Other family: Map | 7,054 | 194,112 | 21,027,919 |
| Male householder, no wife present Map | 2,280 | 66,525 | 5,777,570 |
| Female householder, no husband present Map | 4,774 | 127,587 | 15,250,349 |
| Nonfamily households: Map | 7,450 | 349,629 | 39,177,996 |
| Householder living alone Map | 5,147 | 258,409 | 31,204,909 |
| Householder not living alone Map | 2,303 | 91,220 | 7,973,087 |
| HOUSEHOLDS, HISPANIC OR LATINO ORIGIN OF HOUSEHOLDER | |||
| Not Hispanic or Latino householder: Map | 23,205 | 820,824 | 103,254,926 |
| Hispanic or Latino householder: Map | 7,408 | 185,426 | 13,461,366 |
| HOUSEHOLDS, RACE OF HOUSEHOLDER | |||
| Householder who is White alone | 16,609 | 730,548 | 89,754,352 |
| Householder who is Black or African American alone | 6,593 | 81,599 | 14,129,983 |
| Householder who is American Indian and Alaska Native alone | 227 | 11,237 | 939,707 |
| Householder who is Asian alone | 2,011 | 64,558 | 4,632,164 |
| Householder who is Native Hawaiian and Other Pacific Islander alone | 278 | 4,964 | 143,932 |
| Householder who is Some Other Race alone | 3,610 | 83,261 | 4,916,427 |
| Householder who is Two or More Races | 1,285 | 30,083 | 2,199,727 |
| HOUSEHOLDS, HOUSEHOLD TYPE BY HOUSEHOLD SIZE | |||
| Family households: Map | 23,163 | 656,621 | 77,538,296 |
| 2-person household Map | 6,617 | 259,433 | 31,882,616 |
| 3-person household Map | 5,315 | 145,699 | 17,765,829 |
| 4-person household Map | 5,110 | 124,486 | 15,214,075 |
| 5-person household Map | 3,227 | 69,451 | 7,411,997 |
| 6-person household Map | 1,608 | 32,318 | 3,026,278 |
| 7-or-more-person household Map | 1,286 | 25,234 | 2,237,501 |
| Nonfamily households: Map | 7,450 | 349,629 | 39,177,996 |
| 1-person household Map | 5,147 | 258,409 | 31,204,909 |
| 2-person household Map | 1,815 | 73,314 | 6,360,012 |
| 3-person household Map | 314 | 11,737 | 992,156 |
| 4-person household Map | 125 | 4,131 | 411,171 |
| 5-person household Map | 27 | 1,258 | 126,634 |
| 6-person household Map | 14 | 440 | 48,421 |
| 7-or-more-person household Map | 8 | 340 | 34,693 |
| HOUSING UNITS | |||
| Total Housing Units Map | 35,403 | 1,173,814 | 131,704,730 |
| HOUSING UNITS, OCCUPANCY STATUS | |||
| Occupied Map | 30,613 | 1,006,250 | 116,716,292 |
| Vacant Map | 4,790 | 167,564 | 14,988,438 |
| HOUSING UNITS, OCCUPIED, TENURE | |||
| Owned with a mortgage or a loan Map | 18,083 | 465,029 | 52,979,430 |
| Owned free and clear Map | 1,411 | 126,451 | 23,006,644 |
| Renter occupied Map | 11,119 | 414,770 | 40,730,218 |
| HOUSING UNITS, VACANT, VACANCY STATUS | |||
| For rent Map | 1,840 | 61,985 | 4,137,567 |
| Rented, not occupied Map | 31 | 1,838 | 206,825 |
| For sale only Map | 1,245 | 32,949 | 1,896,796 |
| Sold, not occupied Map | 80 | 3,416 | 421,032 |
| For seasonal, recreational, or occasional use Map | 279 | 32,703 | 4,649,298 |
| For migrant workers Map | 2 | 242 | 24,161 |
| Other vacant Map | 1,313 | 34,431 | 3,652,759 |
| HOUSING UNITS, OCCUPIED, AVERAGE HOUSEHOLD SIZE BY TENURE | |||
| Total: Map | 3.14 | 2.65 | 2.58 |
| Owner occupied Map | 3.11 | 2.66 | 2.65 |
| Renter occupied Map | 3.20 | 2.63 | 2.44 |
| HOUSING UNITS, OCCUPIED, TENURE BY RACE OF HOUSEHOLDER | |||
| Owner occupied: Map | 19,494 | 591,480 | 75,986,074 |
| Householder who is White alone Map | 11,717 | 465,605 | 63,446,275 |
| Householder who is Black or African American alone Map | 3,108 | 28,560 | 6,261,464 |
| Householder who is American Indian and Alaska Native alone Map | 121 | 5,842 | 509,588 |
| Householder who is Asian alone Map | 1,468 | 40,436 | 2,688,861 |
| Householder who is Native Hawaiian and Other Pacific Islander alone Map | 141 | 1,890 | 61,911 |
| Householder who is Some Other Race alone Map | 2,208 | 35,072 | 1,975,817 |
| Householder who is Two or More Races Map | 731 | 14,075 | 1,042,158 |
| Renter occupied: Map | 11,119 | 414,770 | 40,730,218 |
| Householder who is White alone Map | 4,892 | 264,943 | 26,308,077 |
| Householder who is Black or African American alone Map | 3,485 | 53,039 | 7,868,519 |
| Householder who is American Indian and Alaska Native alone Map | 106 | 5,395 | 430,119 |
| Householder who is Asian alone Map | 543 | 24,122 | 1,943,303 |
| Householder who is Native Hawaiian and Other Pacific Islander alone Map | 137 | 3,074 | 82,021 |
| Householder who is Some Other Race alone Map | 1,402 | 48,189 | 2,940,610 |
| Householder who is Two or More Races Map | 554 | 16,008 | 1,157,569 |
| HOUSING UNITS, OCCUPIED, TENURE BY HISPANIC OR LATINO ORIGIN OF HOUSEHOLDER | |||
| Owner occupied: Map | 19,494 | 591,480 | 75,986,074 |
| Not Hispanic or Latino householder Map | 14,773 | 505,161 | 69,617,625 |
| Hispanic or Latino householder Map | 4,721 | 86,319 | 6,368,449 |
| Renter occupied: Map | 11,119 | 414,770 | 40,730,218 |
| Not Hispanic or Latino householder Map | 8,432 | 315,663 | 33,637,301 |
| Hispanic or Latino householder Map | 2,687 | 99,107 | 7,092,917 |
| HOUSING UNITS, OCCUPIED, TENURE BY HOUSEHOLD SIZE | |||
| Owner occupied: Map | 19,494 | 591,480 | 75,986,074 |
| 1-person household Map | 2,955 | 128,770 | 16,453,569 |
| 2-person household Map | 5,844 | 221,534 | 27,618,605 |
| 3-person household Map | 3,622 | 92,417 | 12,517,563 |
| 4-person household Map | 3,373 | 77,088 | 10,998,793 |
| 5-person household Map | 2,003 | 39,969 | 5,057,765 |
| 6-person household Map | 965 | 18,011 | 1,965,796 |
| 7-or-more-person household Map | 732 | 13,691 | 1,373,983 |
| Renter occupied: Map | 11,119 | 414,770 | 40,730,218 |
| 1-person household Map | 2,192 | 129,639 | 14,751,340 |
| 2-person household Map | 2,588 | 111,213 | 10,624,023 |
| 3-person household Map | 2,007 | 65,019 | 6,240,422 |
| 4-person household Map | 1,862 | 51,529 | 4,626,453 |
| 5-person household Map | 1,251 | 30,740 | 2,480,866 |
| 6-person household Map | 657 | 14,747 | 1,108,903 |
| 7-or-more-person household Map | 562 | 11,883 | 898,211 |
Loading...